As an Amazon Associate I earn from qualifying purchases.
The idea behind the Agile approach to project management is to encourage collaboration, transparency, and responsiveness to feedback among an integrated team. Agile software development means using the set of principles outlined in the Agile manifesto to develop high-quality working software, frequently.
The Agile methodology emphasizes fast-paced software development, meaning software testing must also be performed at speed while remaining thorough enough to ensure high quality.
It is vital for Agile teams to find a way to evaluate and improve their testing efforts. Test metrics are useful for providing basic measurements of the effectiveness of any software testing effort in Agile teams.
This post outlines what exactly testing is in Agile development by comparing it to traditional testing in the old waterfall framework for software development. You’ll also find out about Agile test plans and get the low-down on some useful Agile test metrics.
We focus on six key metrics that are relevant to testing in an Agile team. See SeaLights’ agile testing metrics learning section for a wider list of recommended metrics.
After reading this post, you will better understand how to measure the testing efforts of your software development teams and improve on them, leading to higher-quality software and more productive development. In other words, you’ll be better placed to achieve the goals of Agile development.
What Is Agile Testing and an Agile Test Plan?

Before the Agile framework became popular, QA was a separate activity performed by independent testing teams. Today, Agile testing means testing your software for defects as done in an Agile development team.
With Agile testing, developers take part in improving the tests themselves as they work, and with the help of increased automation and rapid feedback, Agile teams can deliver higher-quality software and ship to production faster.
The test plan is an important document formally outlining software testing scope and activities. An Agile test plan differs from a traditional test plan used in the old waterfall approach.
Waterfall is a non-iterative, sequential software development approach in which development is divided into pre-defined phases. Test plans in waterfall are static because detailed requirements are defined before the software design phase. Such plans don’t need much modification over the life of a project.
In contrast to the waterfall approach, an Agile approach calls for a dynamic test plan, which has the adaptability to meet changing requirements. A test strategy is vital because it helps teams to:
- Understand at which points in a sprint they’ll need to test features;
- Proactively create test data to test dependencies between components that are still under development; and
- Know who is responsible for unit tests, when to begin automated testing, and which tools to use for testing.
A dynamic test plan can, therefore, improve the productivity of Agile teams by ensuring thorough preparation for software testing and improved efficiency due to transparency in the testing strategy and processes. This type of test plan helps Agile teams to plan ahead while allowing the team to accommodate changing requirements.
Agile Testing Metrics
After creating a test plan and beginning software testing, it’s important to assess how effective the software tests are by looking at data in the form of relevant metrics. The following metrics are examples of the types of measurements that can help an Agile team better achieve its goals.
Burn-Down Chart
A burn-down chart is useful because of its simplicity as a metric. A burn-down chart plots outstanding work against time. Units of time can be days, iterations, or sprints. You can measure outstanding work in story points, features, and functions.
The ideal line is plotted from the beginning of the iteration or project, and it connects in a straight line to the end point of the project. You can create a burn-down chart using Microsoft Excel or any one of several project management tools, such as Team Foundation Server.
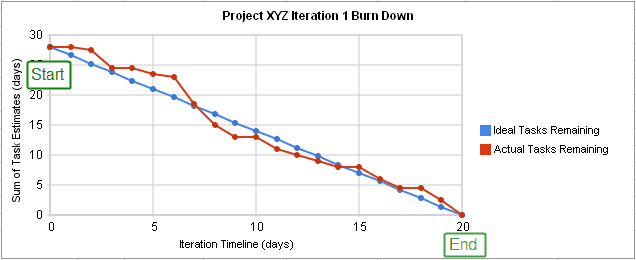
The actual line should track the estimates as closely as possible. The disparity between actual versus ideal in a burn-down chart gives a quick measure of a team’s productivity. Assuming the team accurately estimates its productivity in terms of the ideal line, the burn-down chart provides a simple visual aid to quickly address any concerns when the actual work remaining far exceeds the estimated tasks.
In Agile, a task is considered complete when both the development and the tests are complete. A common term used to define completion is “Done is Done,” meaning the completed tasks that appear on the burn-down chart have been tested and there are no additional related activities.
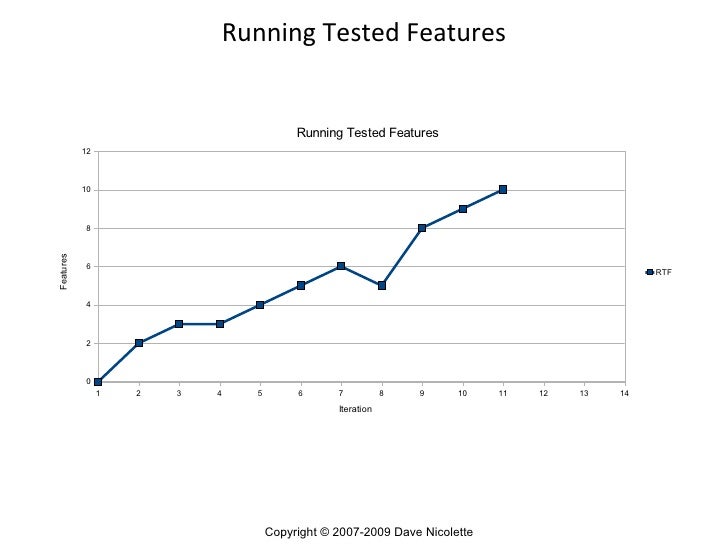
Running Tested Features
Running tested features (RTF) is an Agile metric that measures the amount of customer-defined software features verified as functioning by software tests. This metric is helpful because it essentially makes teams more agile by:
- focusing on features instead of design or infrastructure, and
- verifying each feature as working, producing ready-to-go software at each iteration.
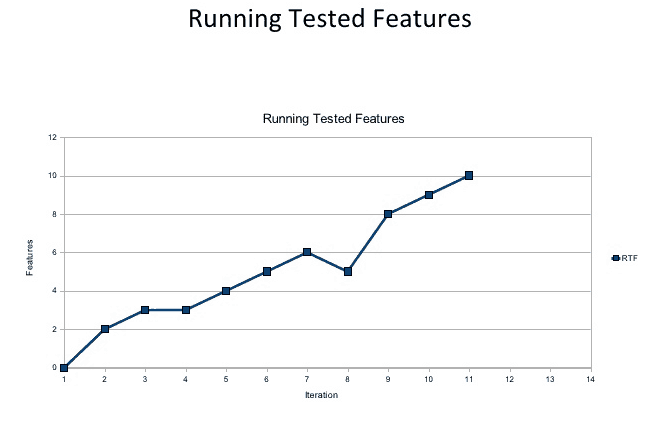
By measuring the RTF growth for a given project, teams can easily analyze whether there are issues with the software coding or the tests used to verify features as functional. The data is visually represented as a line graph based on a count of running tested features, providing easy verification on whether the quantity of running tested features grows with each iteration (as expected).
Cumulative Flow
A cumulative flow diagram maps an entire project’s workflow, including tasks the team still needs to complete and tasks already completed. Since testing is part of the team’s workflow, it is typically included on a cumulative flow diagram.
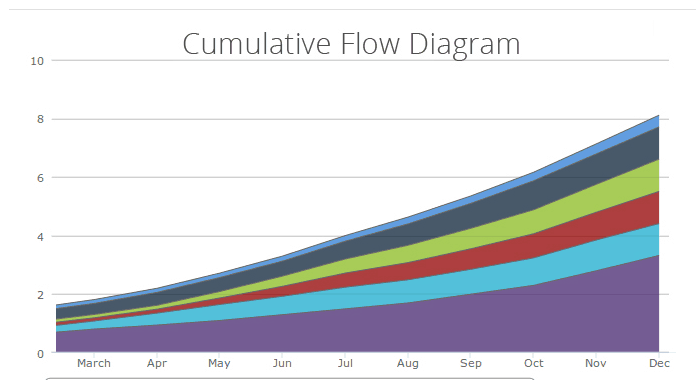
By mapping the entire project workflow, Agile teams get valuable measurements of areas that end up being bottlenecks, with unproductive work in progress showing up as vertical bands that widen over the course of the project. For example, in the above diagram, work-in-progress, represented by the red area, widens over the course of the project, signifying bottlenecks in the project. Such areas of concern can be identified and addressed using this metric. You can create a CFD in Excel.
Defect Cycle Time
Agile teams should strive to fix bugs as quickly as possible. In fact, one of the main aims of the collaborative Agile approach is to fix bugs quicker so that software is released sooner. Such quick fixing can only arise when good tests are written and when testers effectively communicate with developers about defects. Cycle time measures the total time it takes to complete a task from the moment work begins on that task. Therefore, defect cycle time is a useful Agile metric because it conveys how well the Agile team works as a unit in fixing defects.
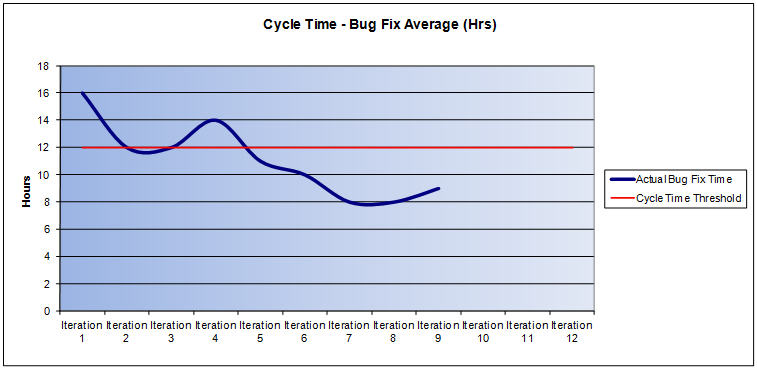
Defect cycle time can be plotted as a graph using Office applications, showing the time it takes to fix defects on the y-axis versus iteration (or other interval) on the x-axis. The ultimate aim is a short defect cycle time as a result of well-designed tests, quick and thorough feedback from testing teams, and prompt fixing by developers. Iterations 6, 7, and 8 in the above chart have short defect cycle times versus the threshold.
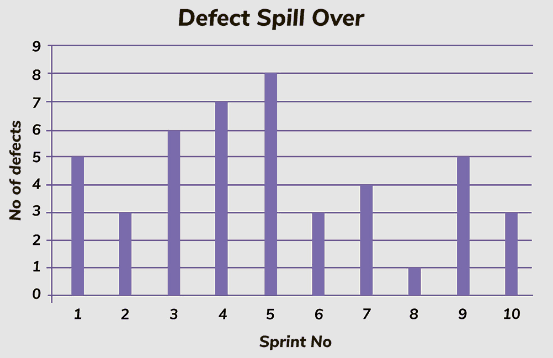
Defect Spill-Over
Agile teams aim to produce working software with each iteration. Defect spillover measures the defects that don’t get fixed during a given iteration or sprint by simply counting the defects remaining at the start of each sprint or iteration.
Such defects can accumulate over time when a team ignores them, leading to technical debt, which decreases productivity. Measuring this metric gives the Agile team an idea of how efficiently they are dealing with issues that arise. A simple bar graph provides a visual aid showing remaining defects per sprint or iteration. Ideally, few if any defects should spill over between intervals.
Velocity
Velocity is a useful metric within the context of an individual team. This metric simply compares the units of work completed during a sprint of a given length against the estimated work units it would take to deliver that sprint.
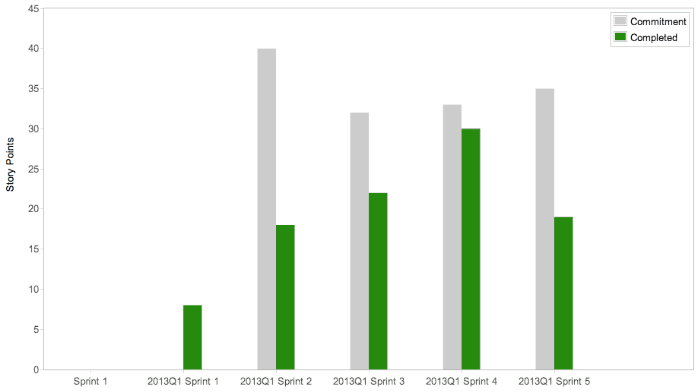
Velocity is a good way of measuring how well an Agile team matures over time. Ideally, velocity should improve with each sprint and then level off at a peak as the team reaches optimum productivity. You can view velocity charts in project management software, such as Atlassian.
Common Agile Testing Issues
Even with the many different metrics to measure, testing is, in itself, a problem for Agile teams. It is clearly essential to test software thoroughly before releasing it, but testing tends to slow down the time to market for software. Therefore, the main Agile testing issues revolve around implementing solutions for improved efficiency and productivity. Some of the main Agile testing challenges are:
- Lack of test coverage. The pressure to get software out quickly can cause teams to write too few tests for user stories. It’s important to have visibility on all code changes to write enough tests to cover the code in a given user story.
- Broken Code. The more frequently a team delivers builds, the higher the chances of breaking existing code. Daily regression testing is impractical with manual test runs. In addition, as the use of microservices becomes more common, where each microservice runs in its own pipeline to production, it is essential to verify that all the moving parts are functioning and are properly integrated.
- Catching Defects Too Late. Defects found late in the development cycle cost much more to fix than those found earlier. This rule applies regardless of your project’s framework. The challenge is to figure out the best way of identifying defects as early as possible in an Agile framework. There is a need to shift left, meaning conducting software tests as early as possible in the development cycle.
- Performance Bottlenecks. Agile teams need to understand how best to monitor software performance so that additional features do not cause significant system slowdowns.
There are also a number of problems associated with tracking certain test metrics. Such metrics create problems because they can either cause confusion, go against Agile principles, or otherwise provide little value. For example:
- Tracking individual metrics. This goes against the Agile ethos because it encourages excessive competition among members of the same team. For example, measuring productivity by counting the number of tests written. Too much competition compromises teamwork and creates quality testing issues.
- Tracking meaningless metrics. Meaningless metrics are those that don’t tell you anything about testing productivity. For example, comparing two Agile Scrum teams on their respective velocities is a poor metric, because velocity is unique to each team, as it depends on estimations unique to each team. Comparing velocities between teams encourages teams to fudge their estimates, leading to poor planning for sprints.
The only way to overcome the potential for using problematic test metrics or using test metrics incorrectly is to promote increased awareness of what constitutes a useful test metric in an Agile team among both team members and project managers.
Agile Testing: How to Shift Left to Get It Right

Shifting left means moving towards testing software at the development stage instead of afterward. Testing conducted at the development stage is preventative rather than diagnostic; by proactively dealing with issues before the build moves forward, less time is wasted trying to find these issues later on.
Shifting left can solve some of the main challenges in Agile, including catching defects as early as possible and improving code coverage.
Some ways to get started with shift left testing are:
- Using test automation to improve continuous delivery and minimize problems associated with broken code—for example, by using automated regression tools;
- Encouraging developers to code with testability in mind, which improves the reliability of the testing framework and speeds up the testing cycle;
- Defining quality controls at all stages of the software development life cycle. Such controls lead to corrective actions at the relevant stage instead of later on, ultimately improving the project’s health.
It’s important to remember that metrics are still very relevant in the shift-left testing approach. You still need to evaluate tests to improve them, and test metrics provide the evidence required to make intelligent decisions about future software tests. Always gather data from the moment the testing effort begins.
Overcome Agile Challenges With a Testing Plan
Agile teams require an approach to testing that reflects the cross-functional environment that Agile encourages.
Before any testing begins, it’s important to outline a test plan. An Agile test plan is dynamic, incorporating emerging and changing requirements over time.
Test metrics in an Agile context are very relevant, but it’s important to understand and use the appropriate metrics. Agile managers should be dissuaded from tracking metrics that are individually oriented.
The “shift left” concept aims to overcome the challenges associated with testing in Agile teams.
Good Code Isn’t What Gets You Paid
The developers landing the senior roles and the consulting offers aren’t better engineers than you. They’re known. RDU is John’s coaching program for developers who are done being the best-kept secret on the team.
Book Your Free Call →
Related Articles

12 REALITIES of Daily Life as a Programmer
What’s the daily life of a programmer like? A programmer’s daily life consists of auditing and debugging code, coding new…

13 POWERFUL Productivity Tips for Developers
Great productivity is one of the best soft skills you can have as a developer. I’ve used these tips to…

Impostor Syndrome as a Programmer
Believing that you’re somewhat unqualified for your job is a problem faced by the best of us. When those thoughts…