I started out my career as a programmer and consultant to build e-commerce sites. Effort estimates have always been around me while developing software. I have made effort estimates myself, and I have also asked other people to do it, then used them in all sorts of plans.\n\nAt the beginning of my career, I was absolutely crappy at making effort estimates. I once estimated a project that, in the end, took ten times longer than first expected. Later on, I gathered some knowledge and became better at it, but I have never liked to do effort estimates, and I think I share that sentiment with many others within the software development industry.\n\nWhen doing effort estimates, there is a certain feeling of unease; you can’t predict the future, and you will be held accountable when more time is spent than was originally estimated. Is there another method we can use besides making effort estimates?\n\n
History
\n\n Through Twitter, the three initiators of the NoEstimates movement met for the first time in October 2012. They were Woody Zuill (an American software veteran), Vasco Duarte (a European author and agile practitioner), and Neil Killick (an Australian agile practitioner). By reading each other’s blog posts and continuing the discussion using the hashtag #NoEstimates on Twitter, they soon spread the word to others and the movement got started.\n\nAll of them were questioning the ”de facto” use of estimates in managing software development, but they had different ideas about the core problems of using estimates, and therefore different approaches to the solution. If you watch the ongoing #NoEstimates debate today, it can be quite vivid. In later days, Ron Jeffries and Kent Beck (two of the authors behind the Agile Manifesto) joined the discussion and shared their thoughts.\n\n
Three groups
\n\nEven if exploring still takes place regarding NoEstimates, I have tried to sort the positions into three groups:\n\n
- \n
- Continuous delivery
- Forecast/projection driven
- Estimation improvement
\n
\n
\n
\n\nThe first position, continuous delivery, takes on a highly agile path by finding the thing that delivers the most customer value. When the most valuable function/feature/story is found, that, and only that, is implemented and delivered to the customer. The claim is that only when you have done and delivered the most important thing can you go on and find out what the second most important thing is, deliver that, and so on. If waterfall is on one side of the spectrum, where everything is planned upfront, this is the most agile approach at the other end.\n\nBy regularly measuring the throughput of the team, like completed tasks per week, you can use that data to forecast and make projections for the future. As W. Edward Deming stated, your process needs to be in statistical control (stable), i.e., only common causes of variations can be present. This, for example, is achievable for teams that stay together over a longer period of time and are working on the same product.\n\nThe last group I simply call estimation improvement. Those people want to find ways to make estimates more accurate, and therefore more useful, for upfront planning. I see this as an attempt to stick with the waterfall method, and represents the least agile approach.\n\nMy experience is that project forecasts are needed, so I sympathize with the second group.\n\n
Planning a project before it starts
\n\n If you are continuously measuring the capacity of your team, you can do project planning without effort estimation. You can use the following steps:\n\n
- \n
- Measure capacity – Count completed tasks per week for the team.
- Analyze collected data – Analyze your collected data to be able to use it.
- Calculate metrics – Calculate the metrics to be used for forecasting.
- Time plan – Check the times from the time plan, since time is usually a delimiting factor in a project (when the project shall be finished).
- Forecast – Make a forecast using the calculated metrics and the given time constraint.
- Assumptions – Fulfill assumptions so you’ll be able to plan using this method.
- Similarities – Use the forecast and compare with other known references.
- Think – Given the gathered knowledge, think and judge if the project is feasible; if not, take proper actions.
\n
\n
\n
\n
\n
\n
\n
\n
\n\nWith these eight steps, you don’t need to spend valuable time doing effort estimates.\n\n
How It’s Done
\n\n
1. Measure capacity (completed tasks per week)
\n\nTo measure the capacity, every Friday the team leader counts all the stickies that are in the ”Done” column on the Scrum/Kanban board (representing completed tasks) and writes the total sum on the board. This is repeated every Friday. Each sticky corresponds in our board to a sub-task of a story/feature or a bug fix. Hence, the measuring is done on the lowest level of work that we track. The data is also plotted in a graph.\n\n
2. Analyze
\n\nTo be able to use the collected data for further planning, it has to be analyzed. In other words, we must understand and be able to explain the “peaks and valleys”. Likely, the capacity (throughput of completed tasks) is oscillating around an average/median value, with a few tops and bottoms. If the data represents a stable system, we can make predictions for the future.\n\n
3. Calculate metrics
\n\nTo be able to forecast, the following calculations must be made on the collected data using a spreadsheet program:\n\n
- \n
- AVERAGE – The average capacity value considering all weeks.
- MEDIAN – The median capacity value considering all weeks.
- AVG DEVIATION – The average deviation in the capacity value from the AVERAGE.
- MAX (DEVIATION) – Is AVERAGE + AVG DEVIATION, to give a capacity MAX value with deviation considered.
- MIN (DEVIATION) – Is AVERAGE – AVG DEVIATION, to give a capacity MIN value with deviation considered.
\n
\n
\n
\n
\n
\n\n
4. Time plan
\n\nUsually the finish date is set in advance for a project in the time plan. Experience tells us that the capacity of the team will vary during the course of a project. Therefore, I separate the project into three ”sub phases.” Below I add some times from a fictive time plan to calculate the forecast example in the next step:\n\n
- \n
- ”Start up” – Three weeks is the usual amount of time, as it is naturally hard to get going with a new project and get up to speed.
- ”Steady state” – At nine weeks, the team is up to speed and working in normal operation.
- ”Peak” – Three weeks are spent in a final push to get the project ready, and the capacity will be higher than normal.
\n
\n
\n
\n\n
5. Forecast
\n\nTime to do the forecast using some more example values of collected metrics:\n\n
- \n
- ”Start up” – 12 tasks/week, corresponds to the MIN (DEVIATION) value.
- ”Steady state” – 18 tasks/week, corresponds both to the AVERAGE and MEDIAN values.
- ”Peak” – 23 tasks/week, corresponds to the MAX (DEVIATION) value.
\n
\n
\n
\n\nTasks that can be done during the project = (3 x 12) + ( 9 x 18) + (3 x 23) = 36 + 162 + 69 = 267 tasks.\n\n
6. Assumptions
\n\nFor the forecast to hold, the following assumptions are needed:\n\n
- \n
- The team must stay fairly intact during the time of the project. If team members are moved out of the team, the capacity will be lower. If new team members are added, the capacity can increase, but not immediately, since the old team members need to educate the new ones.
- The challenges the team will be facing are roughly the same as in the previous project. For the product development (that we are working with) this can be true, since the next version of the product will add on to the previous version. If radical changes are to be made in the project, the team has to take this into consideration when planning.
- If you have 1) and 2) in place, you should have a stable system that is predictable, i.e., forecasts can be made for the future using previously gathered data.
\n
\n
\n
\n\n
7. Similarities
\n\nI can hear you thinking, ”This doesn’t really say anything!” and that is completely true, of course.\nWe need to compare the forecast with similar things we already know of, like already completed projects.\nThe previous project we did which 482 tasks/bugs solved the ticket control system is an example.\nThis project could deliver 267 / 482 ≈ 55% of the scope, compared to last project.\n\nOk, maybe that doesn’t say so much either. Let’s compare with some functions (some call these epics) and stories from the last project:\n\n
- \n
- ”Function A” (Core changes), 33 tasks in the ticket control system
- ”Function B” (New interface), 26 tasks
- ”Story C” (GUI improvements), 5 tasks
\n
\n
\n
\n\nIn this project we can manage:\n\n
- \n
- 267 / 33 ≈ 8 epics ’similar’ to ”Function A”, or
- 267 / 26 ≈ 10 epics ’similar’ to ”Function B”, or
- 267 / 5 ≈ 53 stories ’similar’ to ”Story C”
\n
\n
\n
\n\nOf course, in reality, the project will consist of a mixture of above. However, this information should be enough for the next step.\n\n
8. Think
\n\nNow it is time to do some thinking and judge the project, particularly considering if the scope we want to do is possible at all given the constraints (in time and staffing). I haven’t been in a situation where the scope is less than what we can handle (i.e., room for more stories to be added). Usually, you want to do more than you can achieve. How do you handle that? You need to consult The Iron Triangle, which follows below.\n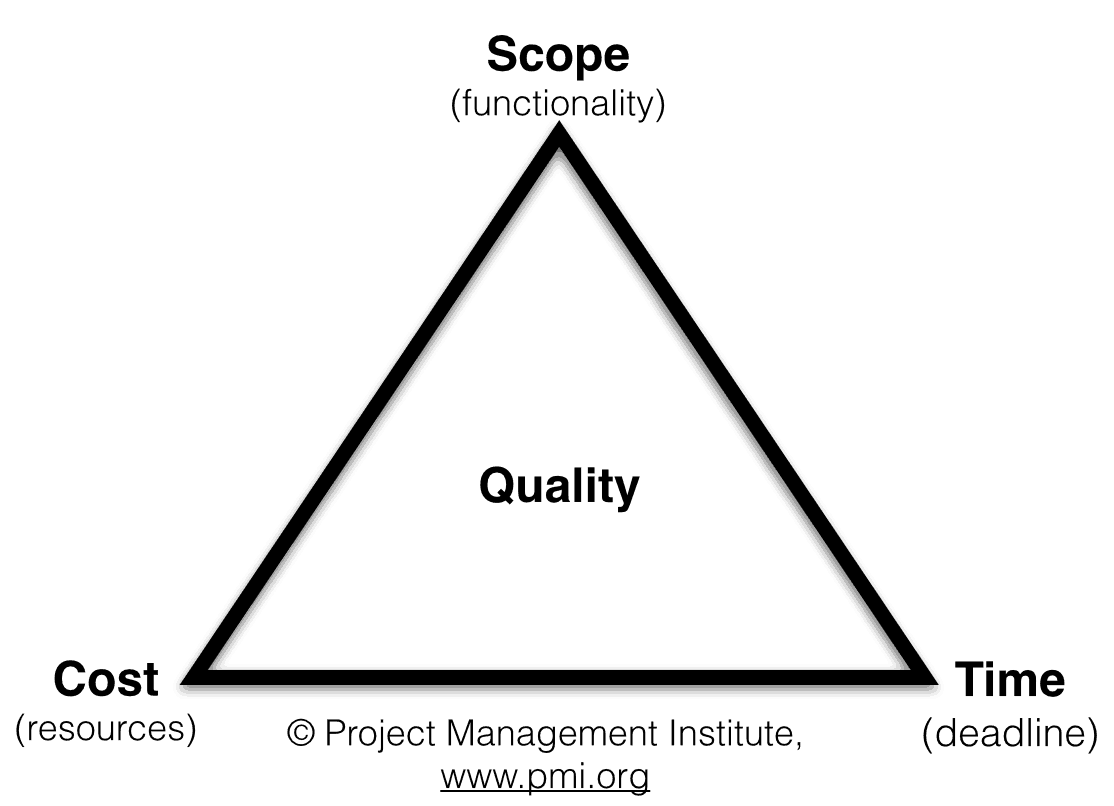 \n\n
\n\n
Steer an ongoing project
\n\nAccording to The Project Management Institute, a project basically depends on three variables:\n\n
- \n
- Time – When the project should be delivered.
- Cost – How many people are working with the project.
- Scope – The content (features and functions, etc.) of the project.
\n
\n
\n
\n\nBasically, it works like this: You can have two variables fixed, but the third needs to be flexible. If you do a fixed price and a fixed time plan project, the scope must be the variable. If all three are fixed and your project runs into trouble, the quality is hurt (and you will be out of business in the long run).\n\nYou can use The Iron Triangle when the project is running, as well as before starting it, to raise questions like:\n\n
- \n
- Scope – Can the scope be reduced? Can some tasks wait to the next project/release of the product? Maybe there are tasks with lower priority (”nice to haves”) that can be skipped altogether, etc.
- Time – Can we extend the time plan? We want all the functions specified in the delivery and we can delay the project (if it’s possible).
- Cost – Can more members be added to the team? Maybe we can have several teams? For small companies this option may not be possible, but for larger companies that can rearrange staff, it may be an option. Is there a simple way to check that your project is on track? You can use a burnup chart.
\n
\n
\n
\n\n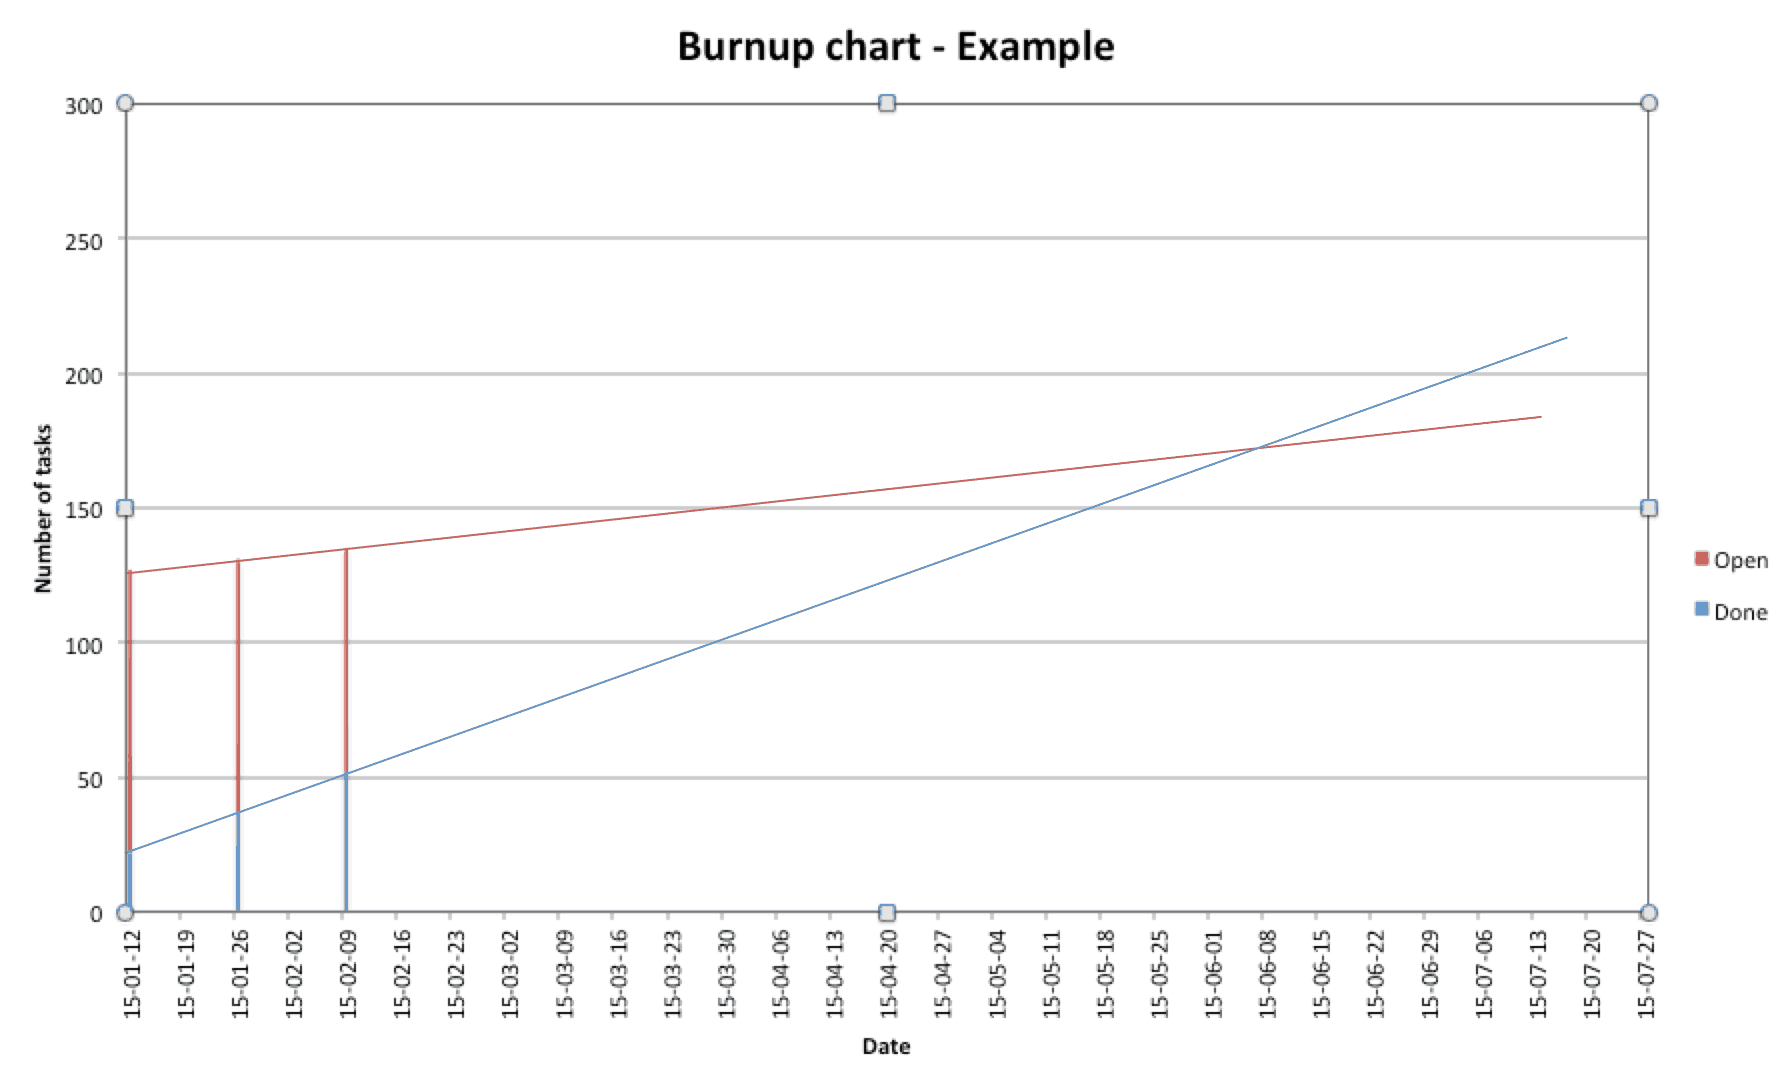 \n\nWhen the project starts, we start to measure two simple things: open tasks (blue in the picture above) and done\ntasks (red). The two parallel lines signify the bar that makes up the total number of tasks. To make these kinds\nof measurements is fairly simple if you are using a ticket control system.\n\nBasically you track:\n\n
- \n
- Task Add Rate (TAR) – Number of tasks that get added per week.
- Task Completion Rate (TCR) – Number of tasks that get completed per week.
\n
\n
\n\nNaturally, your TCR needs to be larger than your TAR, otherwise your project will never be finished.\n\nYour first and second measuring will not say so much, but after that you can start to see trends and make projections (the red and blue lines in the picture above). When those two lines cross, that is the predicted completion date. If you don’t like the projection (or the date), you need to get back to the Iron Triangle to work out if you can do some changes. Measuring and re-planning is something you need to do on a regular basis throughout the whole project.\n\n
 What Next?
\n\nNow you know more about NoEstimates and have some tips and tricks on how to plan and steer a project without doing effort estimation. It is very simple, so start to measure the capacity of your team today! Then, use the steps described in this article to plan and re-plan your project when you need it. Some describe NoEstimates as part of the next step of agile, together with other trends that are questioning other ”de facto” ways we work in the software industry. Let’s unite and minimize the need of effort estimates once and for all!

Related Articles

How to Become a GREAT Software Engineer (Without a Degree?)
If you’re thinking of becoming a software engineer (or developer – they’re very similar, as we’ll talk about below) ……

Best Practices for Mobile UX Designs
As per a report compiled by Statista in 2021, the number of mobile users worldwide stood at 7.1 billion. It…
The Programmer’s Guide to Health & Well-Being in Challenging Times
Staying physically and emotionally healthy during challenging times is never easy. And it’s safe to say that the past few…