So, you have had your mobile app up and running for some time now. Congratulations! You are now ready for the second vital step: making sure all the work you put into the app development and launch is generating the revenues you’re looking for.
Mobile app performance metrics are the most efficient way to measure your app’s functionality. They help you pinpoint the issues that hamper user experience and improvements that need to be made from a technical standpoint.
Clicks, ratings, or the number of app downloads may not provide sufficient data for you to measure your mobile app engagement metrics effectively. Consider the app’s purpose, the goals, and the outcomes you have set to determine which metrics to check for app success.
Here are the top seven metrics that will help you track mobile app engagement and performance.
1. Total Number of Users
This metric measures the cumulative number of downloads and installs of your app since the app launch. Tracking how many people use your app regularly is vital in measuring your mobile user acquisition. However, there is no guarantee that because an individual has downloaded and installed your app, they will use it.
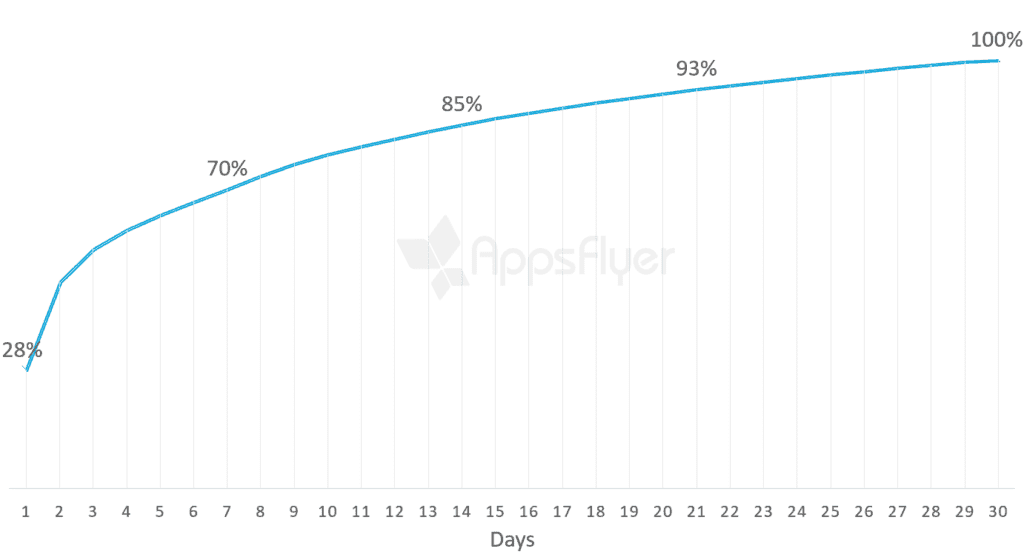
A study by AppsFlyer found that 28% of apps get uninstalled in the first 30 days. The first seven days are particularly crucial because 70% of all uninstalls happen within that time frame. If you want users to keep your app installed on their devices, you have seven days to convince them that your app provides value:
In tracking the total number of users, there are two things you should check:
- Downloads: The number of new downloads given a specific timeframe; for example, on a daily, weekly, or monthly basis. One way to increase your downloads is by sending sales emails.
- Download attribution: Where do your new users come from?
Knowing the number of downloads can help you assess the performance of your marketing campaigns. If you know where your new users are coming from, you can also determine where you should direct your marketing efforts to ensure new user growth.
2. Active Users
These metrics show the number of people who use the app regularly rather than those who only downloaded it. They give you a clear baseline understanding of your app’s growth and its usability.
Suppose your active users (daily active users, weekly active users, and monthly active users) are always on an upward trajectory. In that case, it is a sign of your app’s good health and, therefore, profitability. The number of active users on the app should be higher than that of new users. That is desirable because it indicates there are recurring users on your app.
With the active users metric, you can also determine a marketing campaign’s effectiveness or ineffectiveness. For instance, a sudden increase in the number of active users following a push notification campaign may indicate that this is effective.
Additionally, seek to find out which days your customers are most active on your app, because this is when you can upsell to a more advanced plan, offer discounts and exclusive deals, or ask them to encourage their friends to download your app too.
You should also look at more in-depth data per active user to develop conversion-focused campaigns. This in-depth data can be their demographics and in-app spending, among others.

The active users metric can also help you determine other vital metrics such as lifetime value and retention rate. We’ll look at these metrics in more detail later.
Apart from push notifications, you can use guest posts to promote what users can do on your app on other authority websites if you notice a decline in your active user metric.
You can ask a quality guest post service to write a list post, like the one shown in the image above.
3. Average Session Length
The session length is the period of time between the user’s opening and closing of an app. In other words, it is the time between the first user activity and the last user activity on the app.
To calculate your average session length, add the individual session lengths and divide this by the total sessions during that same timeframe.
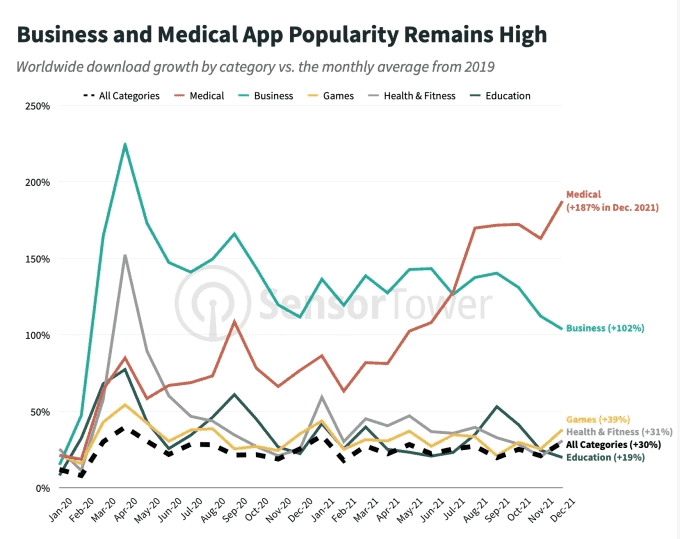
Overall, according to Statista, the average app session length per user worldwide increased from 2019 to 2021. This growth was likely driven by the pandemic. With most users staying home or on a hybrid working setup, app developers also had to pivot to apps that allowed users to transact business remotely, such as medical, banking, shopping, and classifieds:
However, these figures aren’t necessarily good or bad.
Although app developers would typically rejoice when a user spends a long time on their app, in some cases, they don’t. That’s because there are times when a user spending a lot of time using an app is an indication that there are problems in the app that need to be addressed. So, the way you gauge average session length depends on your industry.
For instance, Netflix benefits from having users spend more time on their mobile app. It indicates to the developers that the recommendations align with the user’s preferences. However, if a user spends a long time on the Uber app, it has a negative implication. It means the users spent longer than necessary to find a ride.
You can calculate this app engagement metric by dividing the total duration of all sessions (in seconds) by the total number of sessions during that same time frame. You can also find this data by looking at your mobile app analytics.
4. Session Interval
The session interval is the amount of time that elapses between two consecutive sessions of a customer using your app. It shows the “stickiness” of your app. It is vital to gaining instant feedback on whether your app experience needs some improvement.
Generally speaking, the shorter a session interval is, the better. Think of it this way: If you pick up your phone to watch YouTube videos on the app just a few minutes after you used it, it means you like using the app and can’t keep your hands off it.
So, you need to create an app in such a way that users will spend less time before they remember your app and return to it. Knowing which features make your app memorable and habit-forming to users will help determine the critical parts of your app you need to focus on because they drive user engagement.
Use reminder emails to bring users back to your app. If you are too busy to create the emails yourself, engage a company that offers quality email services to do so in your stead.
The session interval is a key performance indicator of customer engagement for app developers and marketers to consider.
5. Lifetime Value
Lifetime value is a core metric in mobile business growth. It measures how much money a user spends overall using a specific app. It helps app developers and business owners find out how well they are monetizing.
In other words, the lifetime value is a crucial metric to measure since it refers to the total revenue you earn from a user before they cease using your app. To calculate lifetime value, you need to:
- Determine your average purchase value by dividing the total app revenue over a specific period by the number of app purchases made during the same period.
- Get the average purchase frequency rate by dividing the number of purchases made in a specific period by the number of unique users who made purchases during the same period.
- Calculate the user value by multiplying the average purchase frequency rate by the average purchase value.
- Calculate the user lifespan by getting the average number of years that sees a user making an in-app purchase or using your app in general.
- Multiply the average user lifespan by the user value to get the lifetime value.
The lifetime value is an important metric to measure since it will assist you in estimating how much money your app will make in the future and how much money you should be willing to invest.
Let us take Netflix as an example. The average subscriber remains subscribed to Netflix for 25 months based on estimates. Netflix has calculated the lifetime value of each user to be $291.25.

If you sign up for Netflix right now, you will pay a monthly subscription fee of $11.65 on average. In 12 months, you will have spent $139.80.
If you were Netflix, would you be willing to spend, say, $150 one-time, big-time in marketing campaigns on a customer? I hope you answered yes, and this is why. One customer spending $139.80 annually for 25 months yields more than the $150 one-time, big-time you spent in marketing campaigns for the customer. In other words, Netflix will still make money, just not in the short run.
As illustrated above, lifetime value helps you make the correct decision about your app marketing strategy. If the user acquisition cost for each user is higher than their lifetime value, you should definitely consider making changes because you’re only losing money.
6. Retention Rate
Retention rate refers to the percentage of people who continue to use your app over a given period, usually 30 days. It is the opposite of the user churn rate, which refers to the percentage of users who have stopped using the app.
To calculate the app retention rate, divide the app’s monthly users by the app installs on a monthly basis.
Combined, stickiness and retention help you assess how “addicted” users are to your app. Retaining customers costs less than acquiring new customers. Therefore, from a business perspective it is better to focus on retaining rather than acquiring app users.
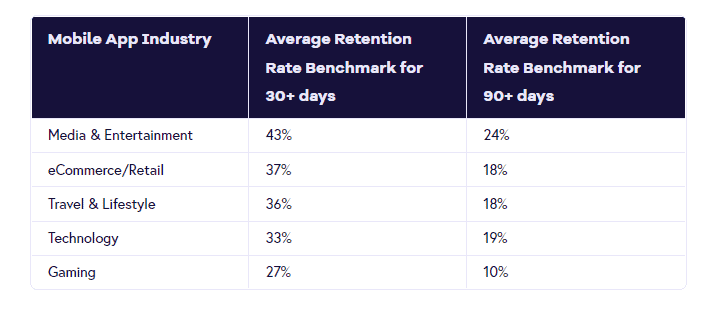
It is no easy task to retain a new app user. According to Geckoboard, although the values vary per industry (see table above), apps generally have a retention rate of 42% after 30 days and a 90-day retention rate of 25%. Geckoboard recommends having a retention rate of 25% or higher after 90 days to be considered successful.
The good news is that there are several ways you can increase your retention rate. Here are some tips:
- Optimize the onboarding flow of your app.
- Personalize the user experience.
- Implement push notifications to remind users of your app’s existence.
- Offer perks to engaged users.
- Make use of in-app messages.
- Continually develop, update, and optimize your app.
- Use gamification.
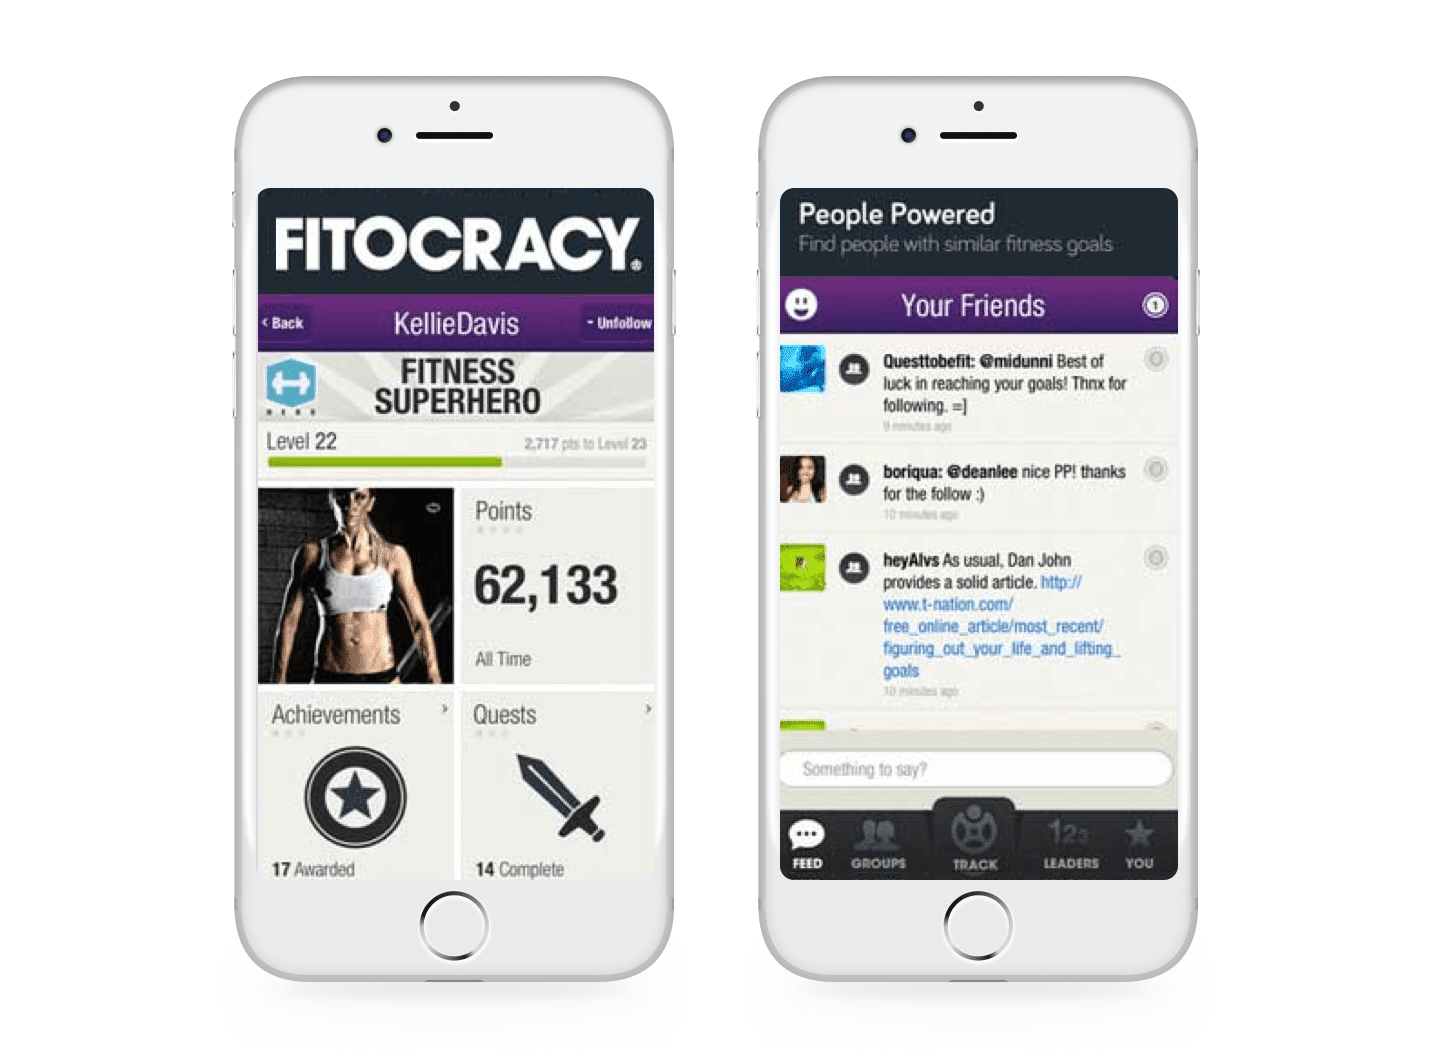
For instance, Fitocracy, a fitness app, rewards users with badges and points when they meet their “quests” and “achievements” as part of its gamification strategy. It also pits users against those with similar fitness goals, making everything look like a competition. That helps keep the app users motivated to reach their goals — and drives user engagement with the app in the long run.
You don’t have to implement all these strategies at once if you don’t have the resources. Use trial and error to determine which strategies work the best for you.
7. Exit Rate
The exit rate tells you where people leave your app after visiting any number of screens. It is different from bounce rate, which is the number of users abandoning your app without engaging with your content.
The exit rate is calculated by dividing the total number of visits to a screen by the total number of drop-offs from that particular screen.
The exit rate metric will give you an idea of your least converting screens. In essence, it tells you what needs fixing in the app. A high exit rate from a screen can indicate that the users are not deriving value from it or that it does not match their expectations.
You can use marketing automation software to tell you more about each screen’s total number of exits. To know the specific reasons users are dropping off, you can utilize usability testing.
Time to Get the Data Rolling
Launching your mobile app is only the first step to achieving your business goals. You still need to monitor app engagement metrics and see how your app is doing.
We have discussed app engagement metrics that will help you gauge the performance of your mobile app. Checking the total number of downloads and installs will help you create strategies to keep current users engaged. Take a look at your active users to know how many downloaders use your app regularly. Finally, look at your lifetime value to see how much revenue your customers are generating.
Session length and session interval will give you a glimpse into how engaged your audience is once they are on the app. Look into your user retention and exit rates to determine app performance.
Make the necessary changes to your app based on these mobile app metrics, and your app user engagement will increase. With time, your app will be well on its way to success.

Related Articles

5G App Development: How To Prepare for the Future of the Internet
5G is the fifth generation of broadband cellular mobile networks and is expected to bring a huge change in the…

Steps to Follow during IoT App Development—Its Ultimate Business Value
Companies who dream of staying ahead of the competition look for ways to achieve the aspect faster by inculcating innovations.…

Best Practices for Mobile UX Designs
As per a report compiled by Statista in 2021, the number of mobile users worldwide stood at 7.1 billion. It…